 Unified clinician dashboard
One sign-in for two care programs
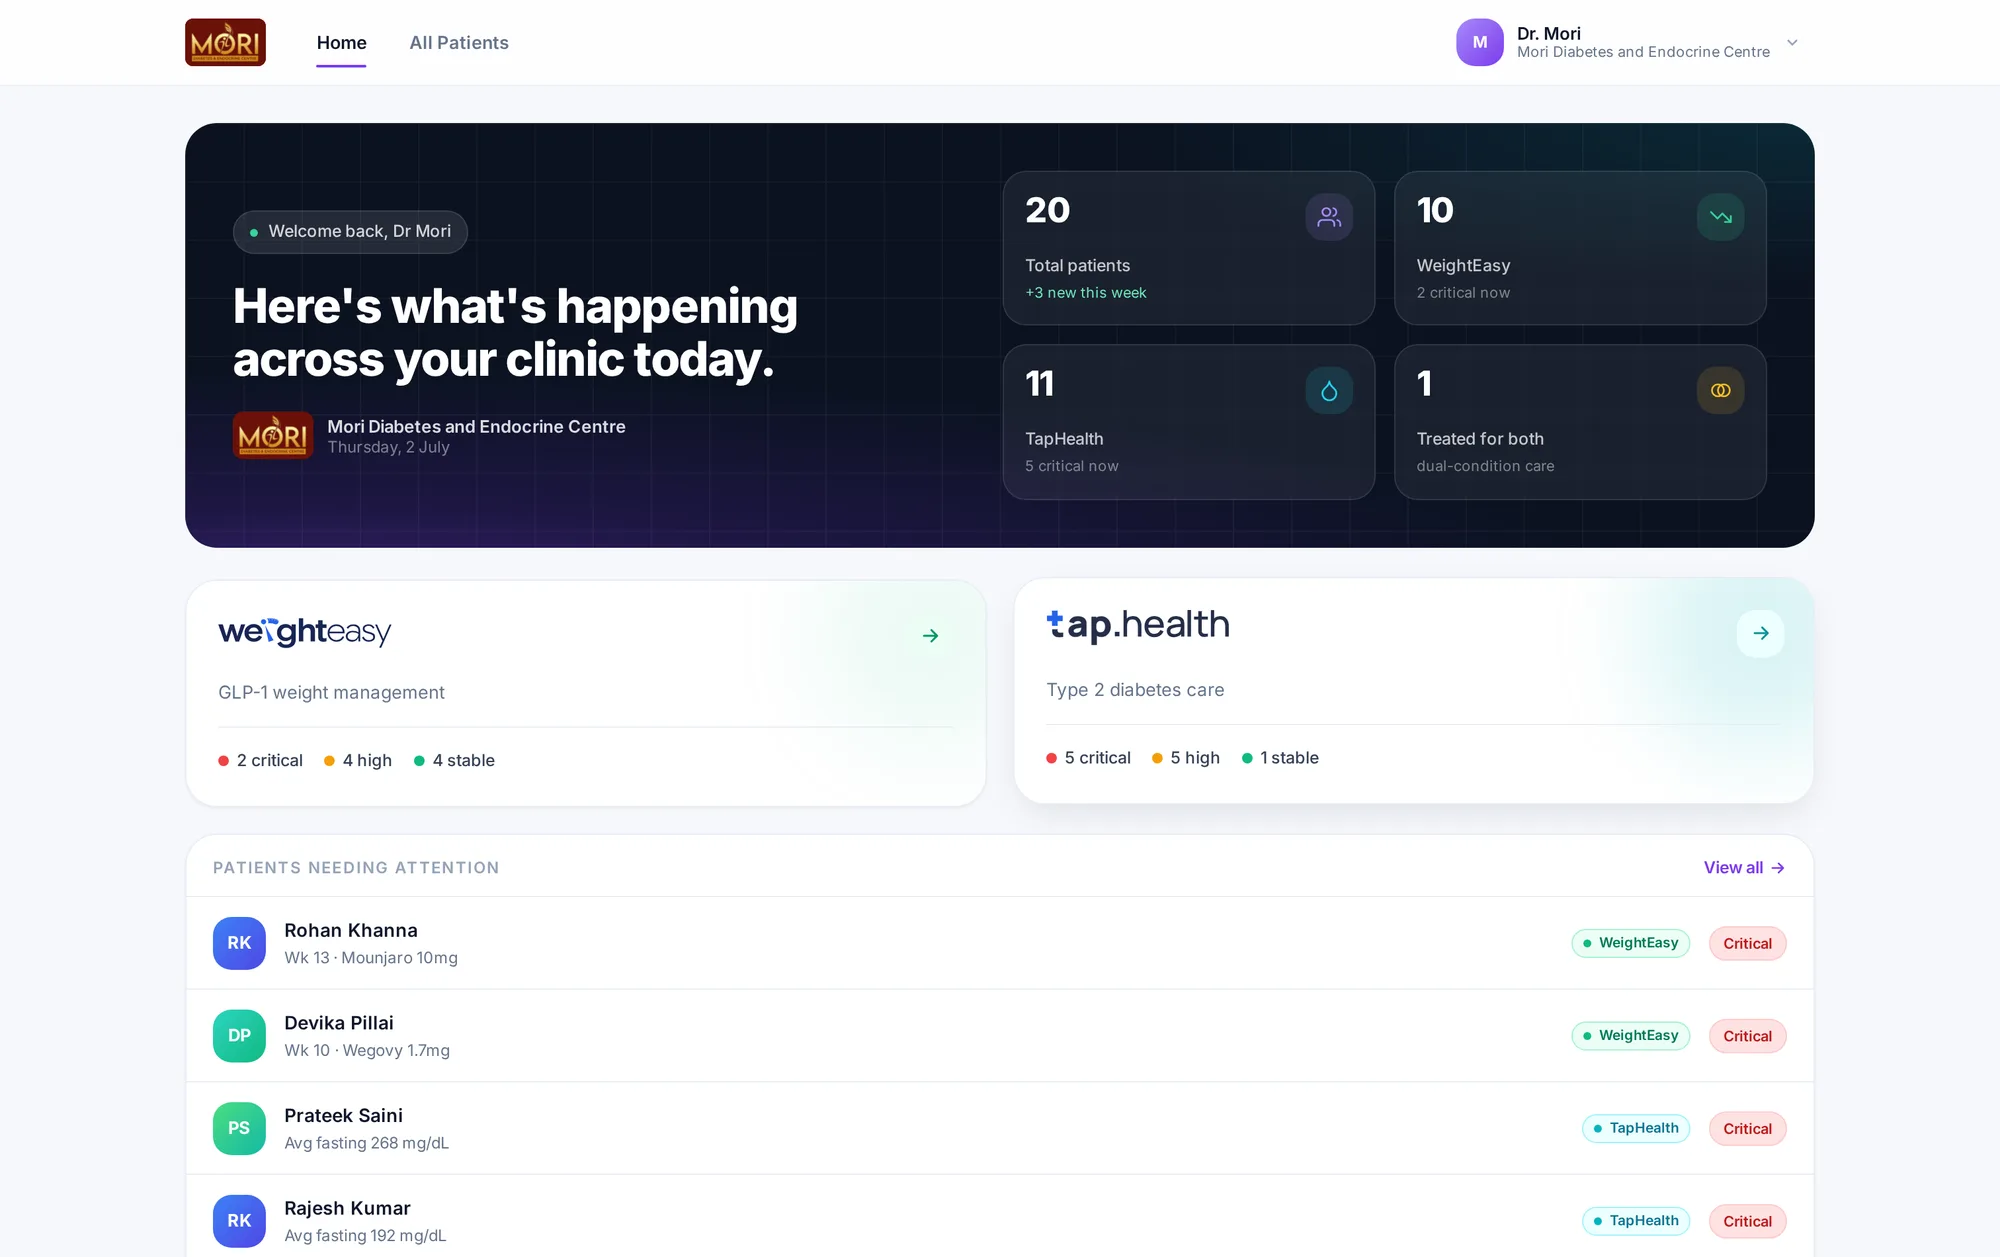
Two clinician dashboards, two logins and two rosters became one clinic home, with AI that cites its sources.
- RolePrincipal Product Designer & Design Engineer, contract
- TimelineJan 2025 to Aug 2026
- PlatformClinician webBuilt in React
The problem
Doctors with patients on both programs logged in twice and reconciled two rosters by hand.
My role
The unified shell, both dashboards, the AI report surfaces and the shared tokens, built as a working React prototype.
Context
The company, the people, the goal
Tap Health runs two patient products that share clinics but not software: WeightEasy for GLP-1 weight management and Tap Health for Type 2 diabetes care. It was also moving from a standalone service to a clinical support tool that works under the doctor's clinical authority, so every duplicated clinician surface doubled onboarding, support and the cost of shipping anything for doctors.
Who it was for
- Doctors
A clinical picture of one patient before the next walks in, and control over the protocol that shapes that patient's plan.
- Clinic staff
Add patients and keep records moving at the front desk, without seeing clinical history they should not.
- Clinics joining Tap Health
Get the clinic and its doctors live the same day, instead of waiting for someone at Tap Health to approve access.
What success meant
- Business goal
One clinician product for two programs, and clinics that set themselves up, so onboarding and support stop growing with every doctor.
- User goal
Run both programs from one home, and read a month of labs and logs quickly, with every AI claim traceable.
- Clinical goal
The platform informs and the clinician decides. Alerts and AI output are informational, never a prescription.
Research
What we did to learn, and what we learned
- Consult observation
Sat in on consults to see where decisions are made. It was the patient report, not the dashboard.
- Product mapping
Laid both clinician dashboards side by side, rosters, sessions and visual languages, to find what could be shared without flattening either.
- First dashboard audit
Reviewed the original diabetes dashboard: read-only, hardcoded priority tiers, and medicines shown as a static list.
- Onboarding trace
Walked the doctor sign-up path step by step, from phone and OTP to the point where a person at Tap Health had to assign the doctor role by hand.
- Prototype in code
Built the shell, roster and report as a working React prototype, so session sharing, deep links and report pacing were judged with real clicks.
- 01
Decisions happen in the report, minutes before the next patient
How we knowIn consults, doctors open one patient and assemble labs, glucose, doses and protocol into a judgment before the next person walks in.
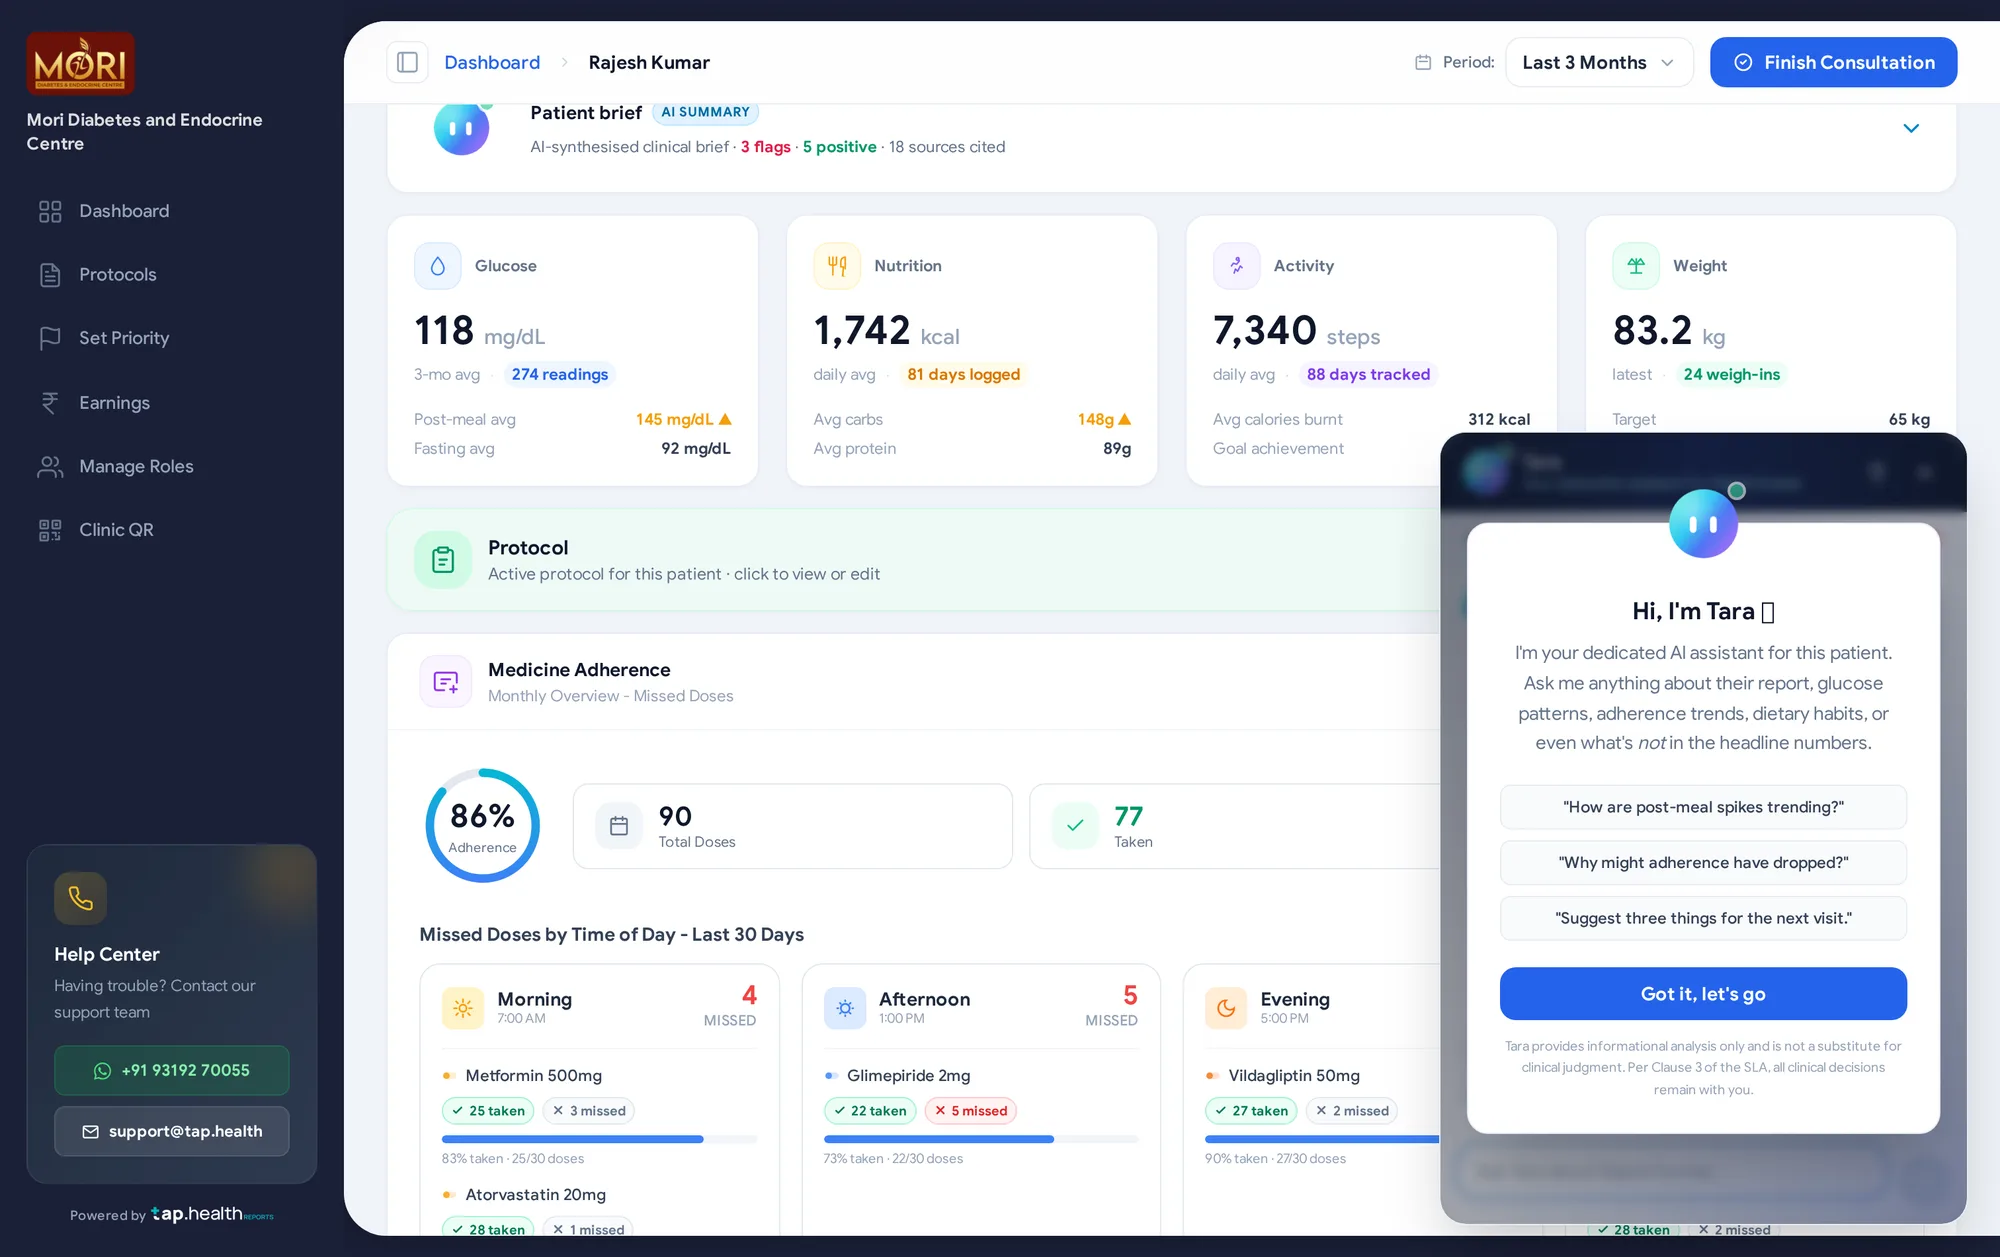
What it changedThe design depth went into the report: an AI brief up top, snapshot cards, the protocol and medicine adherence, each in one calm row.
- 02
Doctors could not see whether medicines were taken
How we knowIn the first dashboard, medicines were a static list. Nothing recorded whether a dose was taken or missed.
What it changedA medicine adherence view by time of day and per medicine, fed by a taken or missed prompt in the patient app.
- 03
Every new doctor waited on a person at Tap Health
How we knowThe sign-up path had a manual step where an admin assigned the doctor role, so every clinic launch queued behind support.
What it changedA self-serve setup in three steps, details, contact and agreement, with the clinic services agreement signed inside the flow.
- 04
An unsourced summary is one more thing to check
How we knowA doctor who acts on a wrong summary owns the mistake, so an AI line without its evidence costs time instead of saving it.
What it changedEvery AI surface is labelled, cites its sources and keeps the original lab PDFs one click away.
Principles
The rules every screen followed
- 1
Unify the shell, not the products
Sign-in, roster and session are shared. Each program keeps its own clinical depth.
- 2
No claim without a source
Every AI line shows where it came from, and the original record is one click away.
- 3
The clinician decides
AI drafts and suggests. Actions stay editable, and nothing acts on its own.
Process
- 01
Sit in on consults
The patient report is the real job. The dashboard is only the way in.
- 02
Map both products
Two rosters, two sessions and two visual languages, side by side.
- 03
Design in code
A working React prototype on one origin, so sign-in was tested for real.
- 04
Make setup self-serve
A new clinic sets itself up in a few short steps.
Key decisions
Decision 01of 03
Two dashboards, one sign-in
Each program had its own login and roster. Now one sign-in opens one roster, and each patient opens in the right product.
BeforeTwo products, two of everything
- Its own login
- Its own roster
- Its own visual language
- Its own login
- Its own roster
- Its own visual language
AfterOne roster across both programs
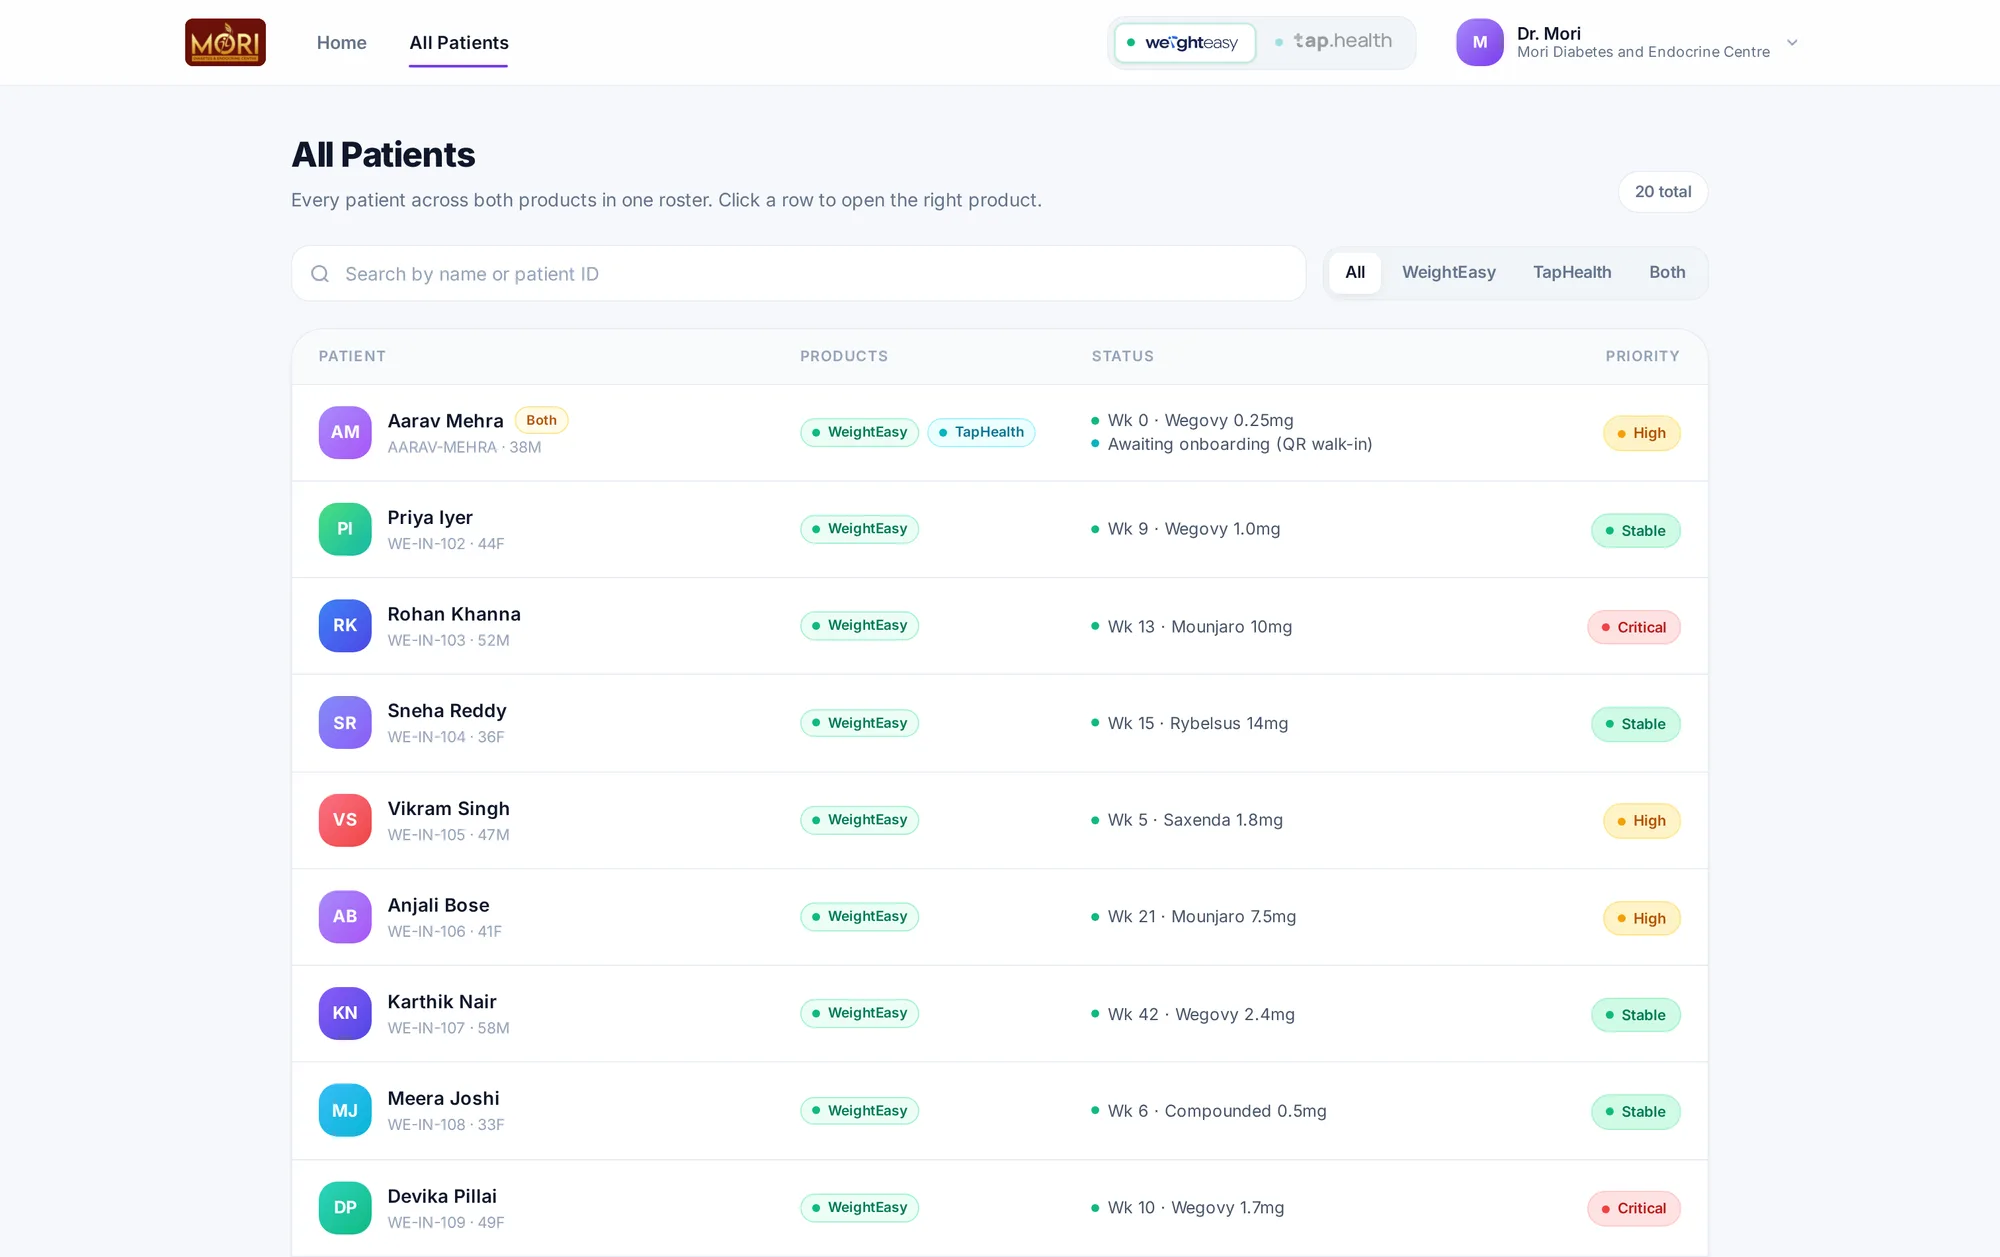 A product tag per patientFilter by program
Decision 02of 03
The report is the product
In consults, decisions happen in the patient report. So that is where the design depth went.
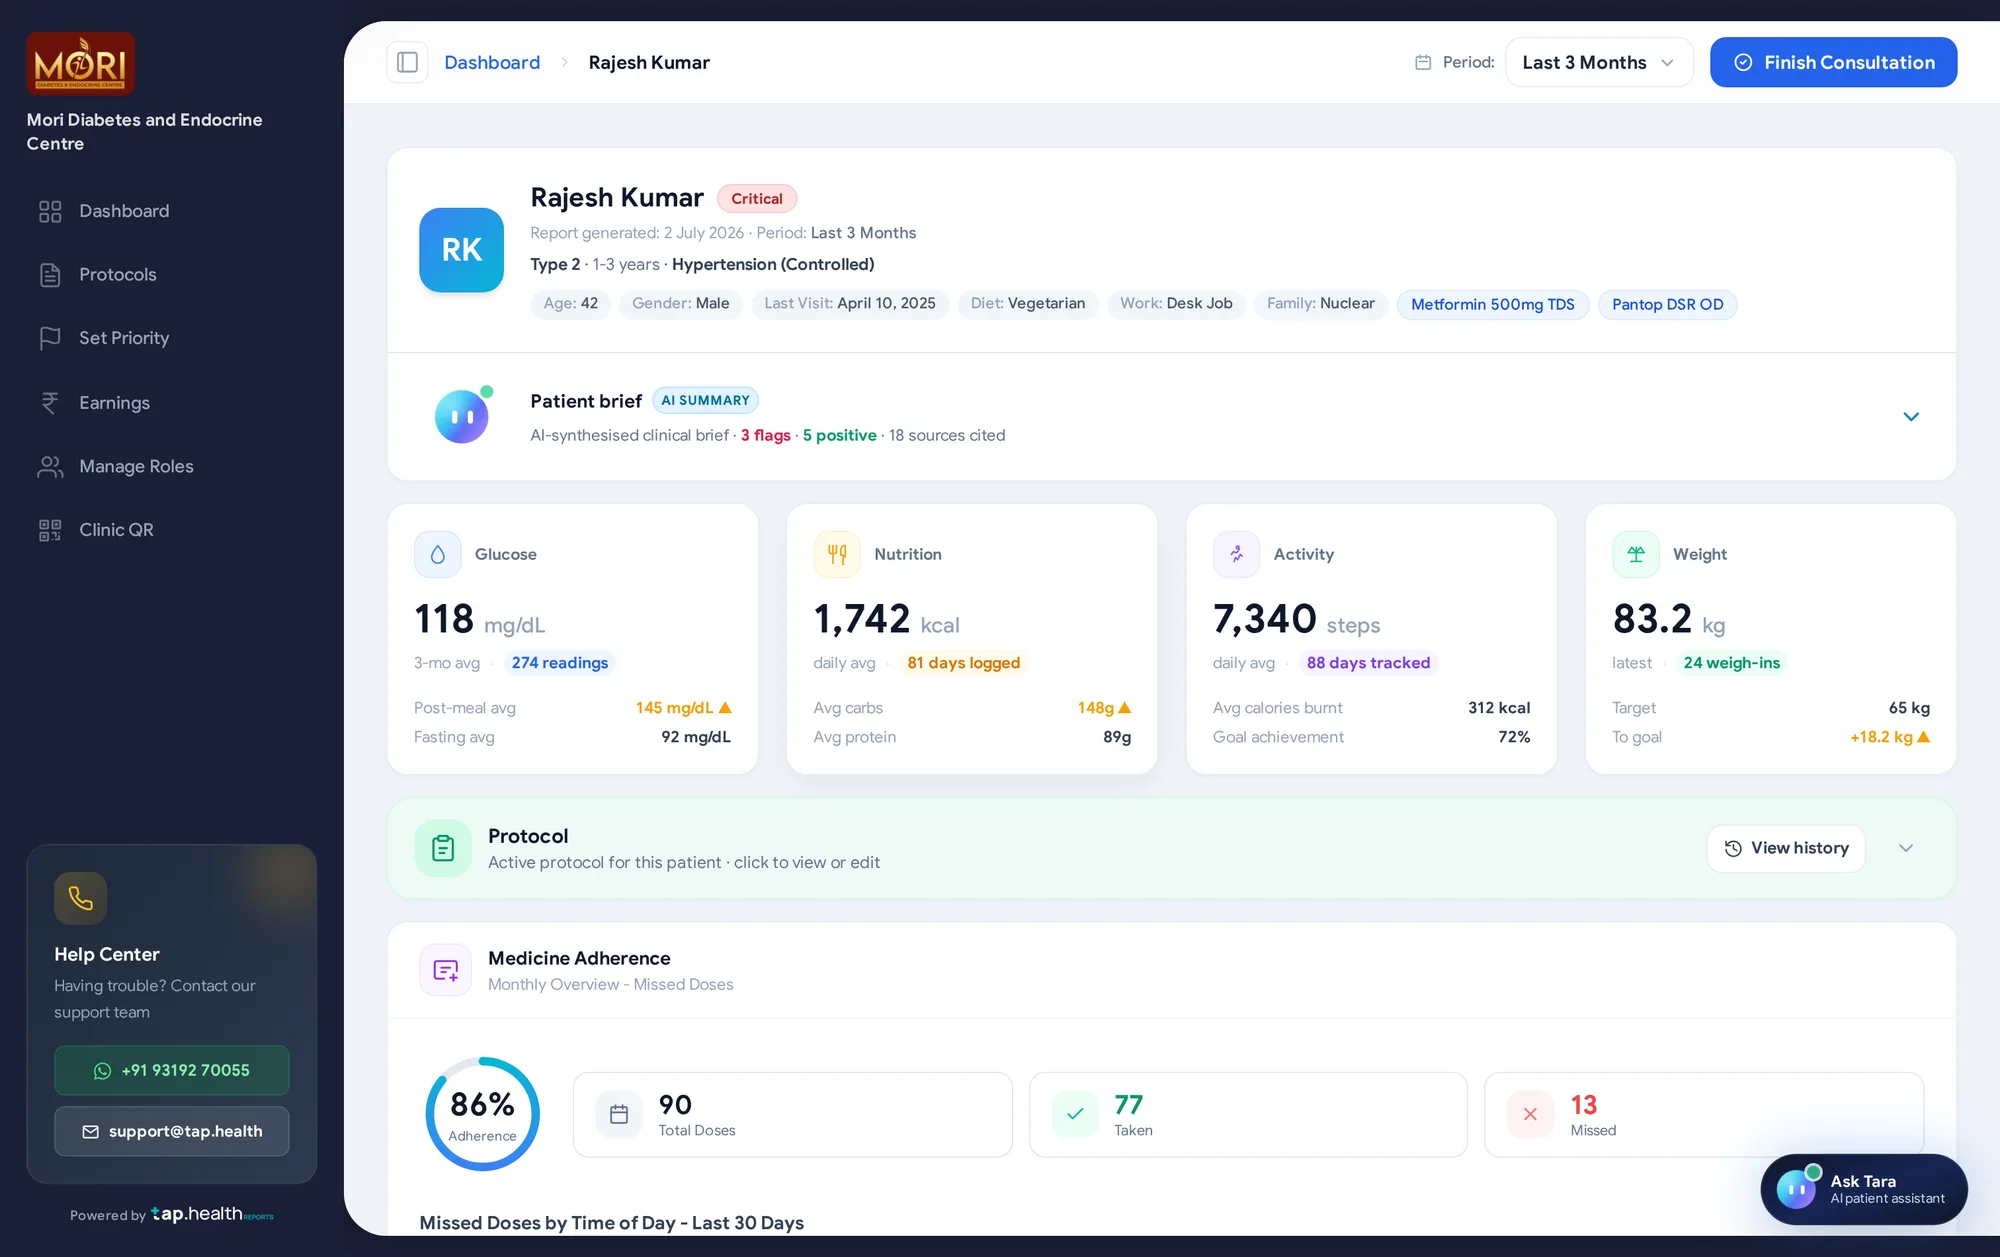 AI brief, with sources countedFour vitals at a glanceProtocol in one calm row
Decision 03of 03
AI that shows its sources
Clinicians won't act on an unattributed summary. Every AI surface cites its sources, and the clinician decides.
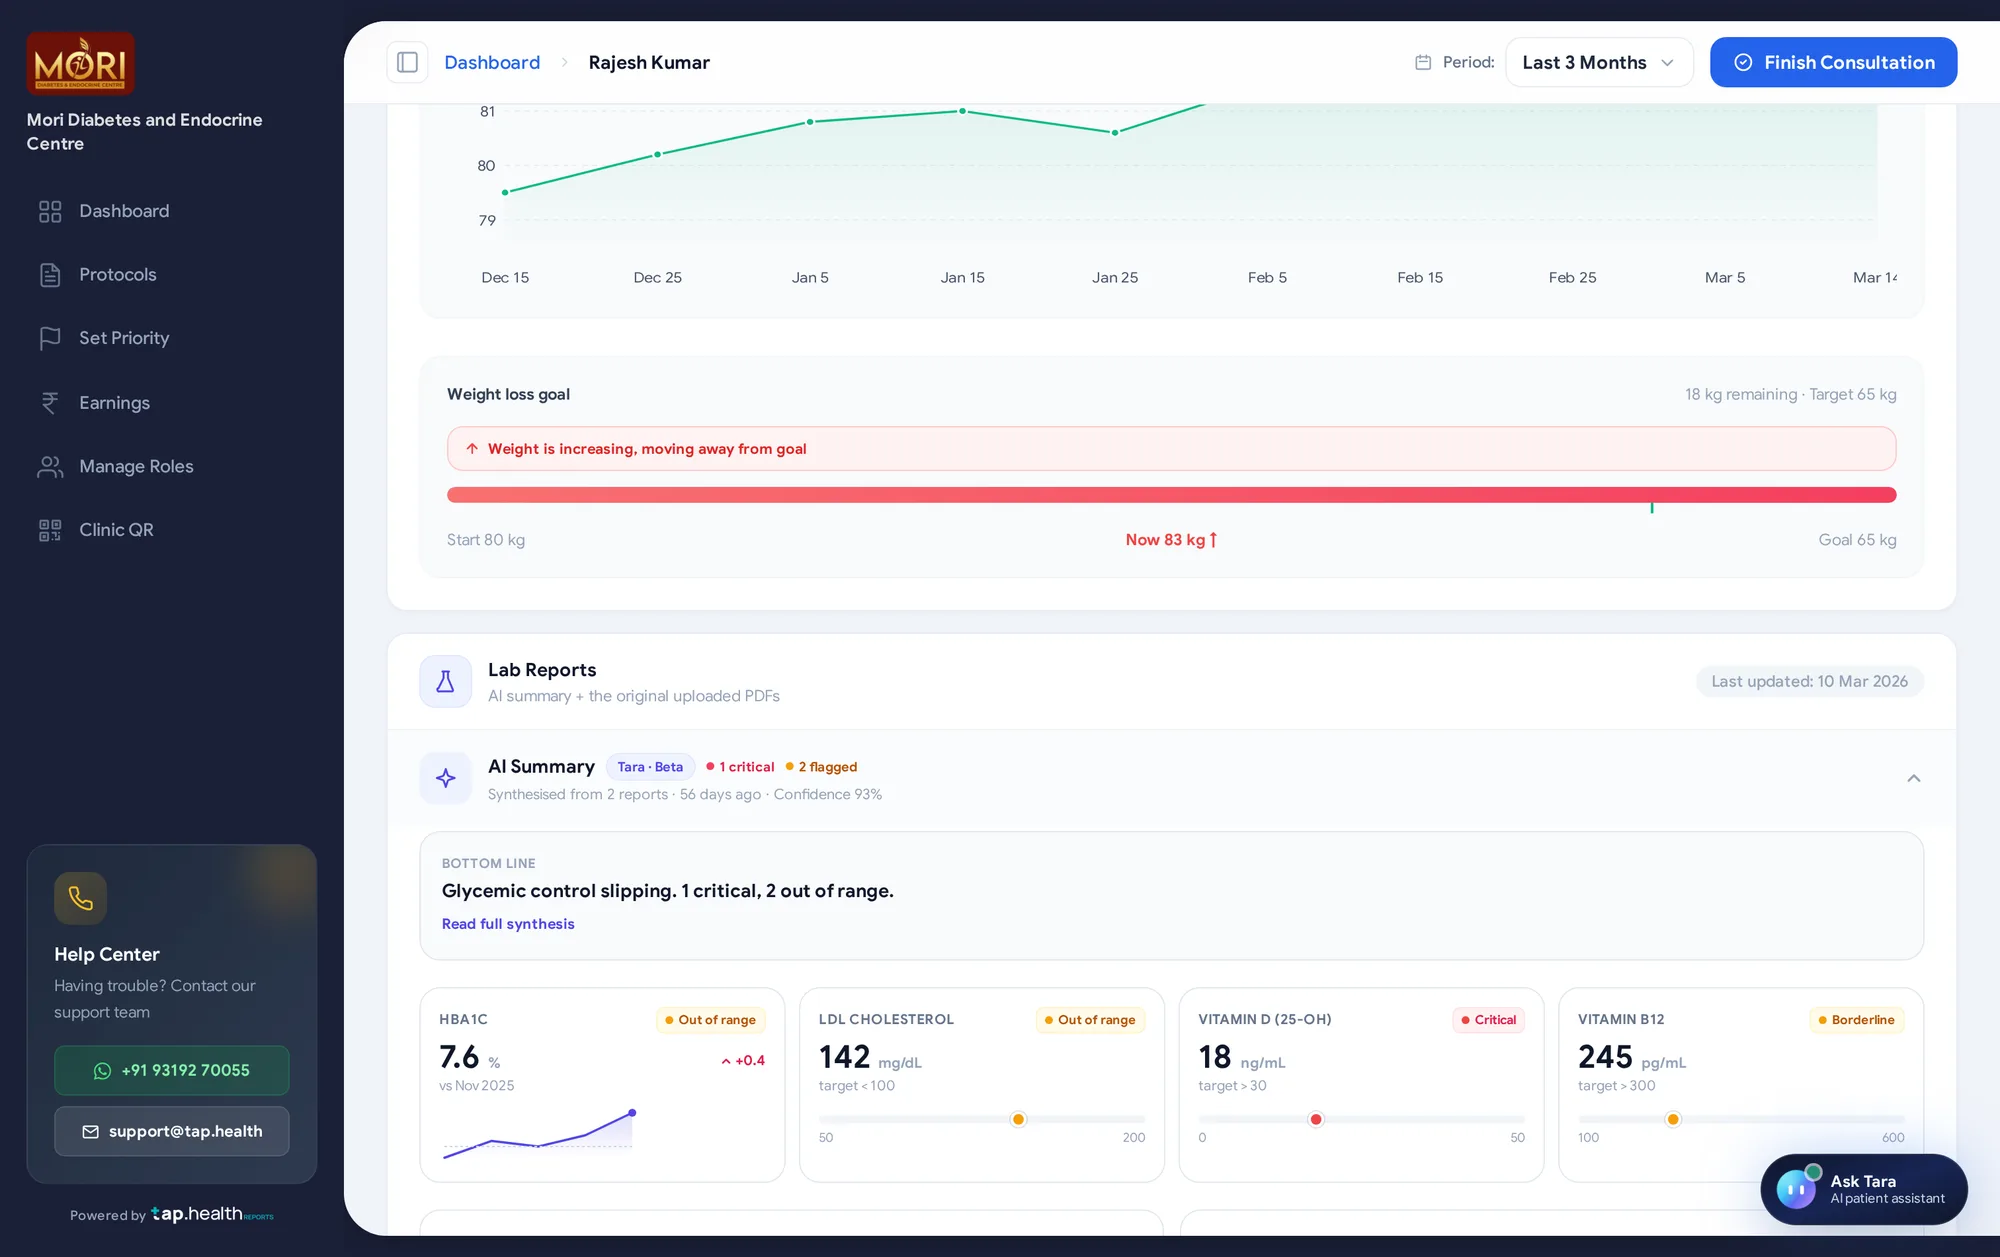 Original PDFs one click awayLabelled AI summary
 Scoped to one patient
The journey after
End to end, as it shipped
- 1The clinic sets itself up
Phone and OTP, then details, contact and an inline agreement. The doctor becomes the clinic admin and gets a clinic QR for walk-in patients.
- 2Set the protocol once
Glucose targets, monitoring, activity and nutrition on one scrollable page with collapsible sections. It sets the bounds for each patient's weekly plan.
- 3Patients join
Staff add a patient at the desk by phone and OTP, or the patient scans the clinic QR.
- 4Open the clinic home
One sign-in shows both programs: today's numbers and the patients who need attention.
- 5Read the report
The AI patient brief with its sources counted, snapshot cards, the active protocol and medicine adherence by time of day.
- 6Check the labs, ask Tara
A lab synthesis with the original PDFs one click away, and Tara answering questions about this one patient, citing each claim.
- 7Decide and close
The clinician edits the suggested actions and finishes the consultation, which stamps the visit.
Edge cases
Designed for the messy moments too
- Patient on both programs
One roster row with a product tag. Opening it lands in the right product, already signed in, with no second login.
- Staff without clinical access
Report sections switched off for a staff member show as locked cards that point them to the clinic admin, not as missing data.
- Agreement not yet accepted
Finish onboarding stays disabled until the clinic services agreement is read and ticked.
- No lab reports yet
Uploading CGM and lab reports is optional at sign-up, with Skip for now. They can be added later from the report.
- Protocol changed mid-week
Patients finish the current week on the old values. The new protocol applies from the next weekly plan.
- Staff member removed
A deactivated member can no longer sign in, but their record stays for audit and the admin can reactivate them.
Outcome
Two clinician dashboards became one product, and neither program lost its clinical depth.
One sign-in, one roster and one visual language, validated as a working React prototype.
- 8 minNew-clinic onboarding, down from 3 to 5 days
- 97%Cut in onboarding time
- 65%Fewer onboarding support contacts
- 89%Protocol adoption in week one
- 2 to 1Clinician dashboards behind one sign-in and one roster
- ShippedBuilt on Pulse, the design system I took from concept to shipped React in 3 weeks
Reflection
Looking back
What I learned
- Unify the seams, keep the depth. The pull was toward one large dashboard; sharing only the shell, session and roster kept what clinicians already trusted.
- Attribution turns scepticism into speed. Doctors used the summaries because each claim led back to its source and each suggestion could be edited.
- Code settles questions frames cannot. Whether a citation is one click away or two only shows up when you use it.
What I would do next
- Close the loop from protocol to plan. A weekly plan review and adjustment view for doctors was the next phase on the roadmap.
- Measure the AI surfaces on their own. Protocol adoption is tracked; how often doctors open the source behind a summary is the number I would add.
 35 transaction states, one calm pattern